

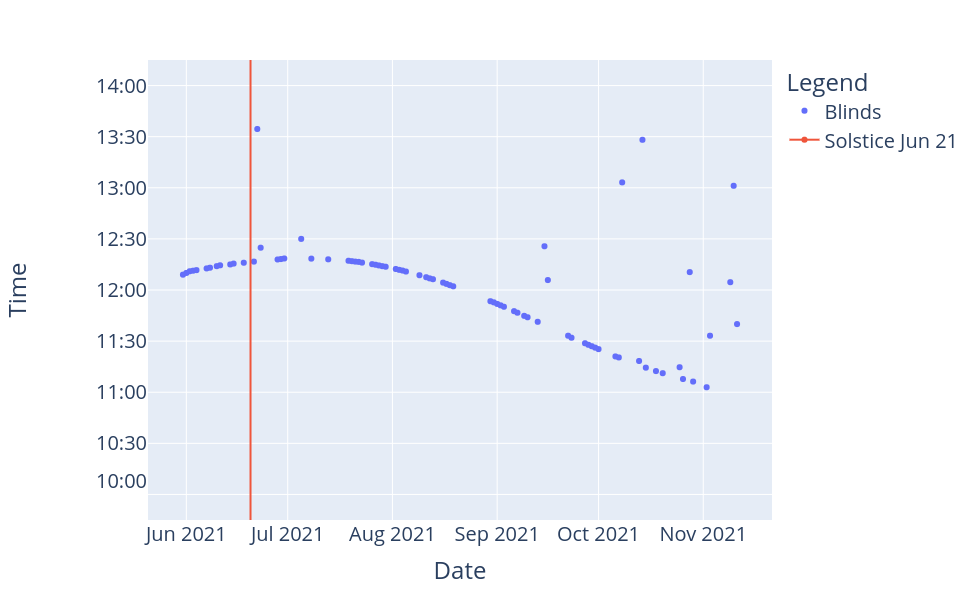
At my workplace, my colleague and I were very annoyed by the blinds that went down at least once a day, usually before lunch, although no sun was shining into our office before afternoon (windows faced west). After a while, we thought we had discovered a pattern. So we started writing down the times when exactly (down to seconds) the blinds went down. Each day when we were in the office. We started recording on May, 31st and in the beginning, the blinds went down later each day until it reached maximum around solstice (but a bit later). Then, amazingly, the process turned around and the blinds shut sooner every day — until we stopped recording around November ‘21, since the blinds did not close anymore in most of the cases. Our collected data can be seen in the following plot. Gaps are due to vacation, home office or weekend.
As a scientific sketch: Lots of data was collected including outliers over a long period of time of a “natural” phenomenon trying to find patterns or correlations to explain the underlying process. First, we established that the smooth shape that the data yield must represent a lower bound for the time, since the outliers exist only above it. As our planet goes through the same cycle every year, we concluded that the blinds, which may have to do with the position of the sun, also behave cyclically. Hence, we were also able to successfully fit a sine function to the data, showing that the aforementioned lower bound for the time has followed and might be following this pattern. Here is the fitted sine function. Details of the function and their parameters (a, b) I will probably describe in another article. For data analysis and visualization, Python and Plotly was used.


However, we need to take another look at the outlier. Since they occur too often, we must conclude that a second variable is included. We assume that some kind of brightness threshold must be exceeded for the blinds to close. Unfortunately, we lack meaningful data on this, but the fact that during the summer there were few to no outliers and from October / November there were almost only outliers or the blinds did not go down at all is evidence for this. By the way, the few data collected in November was corrected to summer time (due to S/W time changeover in the end of October).
Summarizing this, we got two conditions, a variable describing time dependency evaluated by a function f and a second (abstract) variable, most likely for the brightness (however no clear evidence). Both must be fulfilled for the blinds to go down. So, we are confident to propose the following pseudo code controlling blinds movement at our institute:
// f(time): time dependent fitted sine function for lower bound
// brightness: abstract condition to evaluate second variable
if (time > f(time) && brightness > threshold)
    blindsDown();
To return to the scientific sketch: This is consistent work over a long period of time, covering a tiny slice of the scientific map that no one is likely to end up being interested in. And even if the analysis makes a lot of sense, in the end, there might not be a hidden process at all we are trying to identify here, but the landlord might just press a button very precisely every day.

Finally, we will keep an eye on our blinds and check if the future data fit our model. If you have ideas, doubts or questions that will help to move forward with this project, do not hesitate to contact me! In addition, I will write in more detail about the data analysis or model finding soon! Stay tuned.